Engulfing candlestick pattern is one of the first checkpoints and essential factors you need to see in the chart before entering trades.
Combining other technical analysis with an engulfing candlestick pattern can help you trade effectively in the market with a simple mind and make a profit.
In this post, you’ll learn what is an engulfing candlestick pattern and how to trade with it.
What is an engulfing candlestick?
An engulfing candlestick is a two-candle pattern commonly used in technical analysis to identify potential reversals or continuation in the current trend. It can be either bearish or bullish trend.
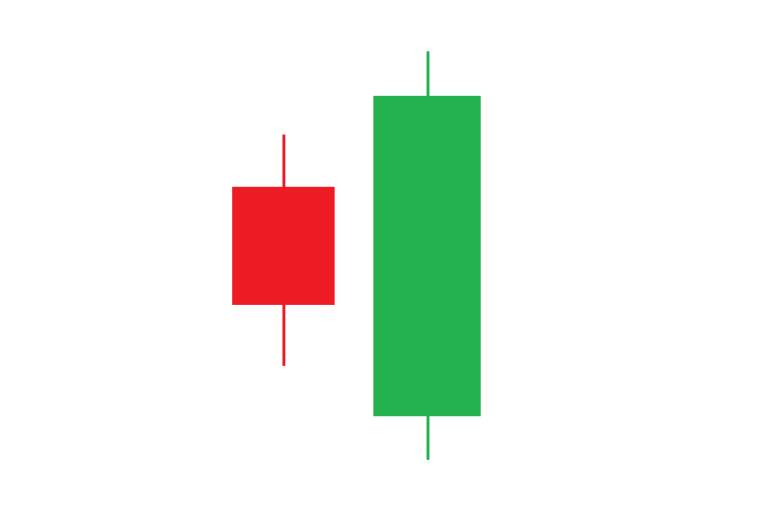
Formation: The first candle is usually small and has a body wick (doji, pinbar, etc.), followed by a bigger body candle (marubozu).
What is bullish engulfing candlestick pattern?
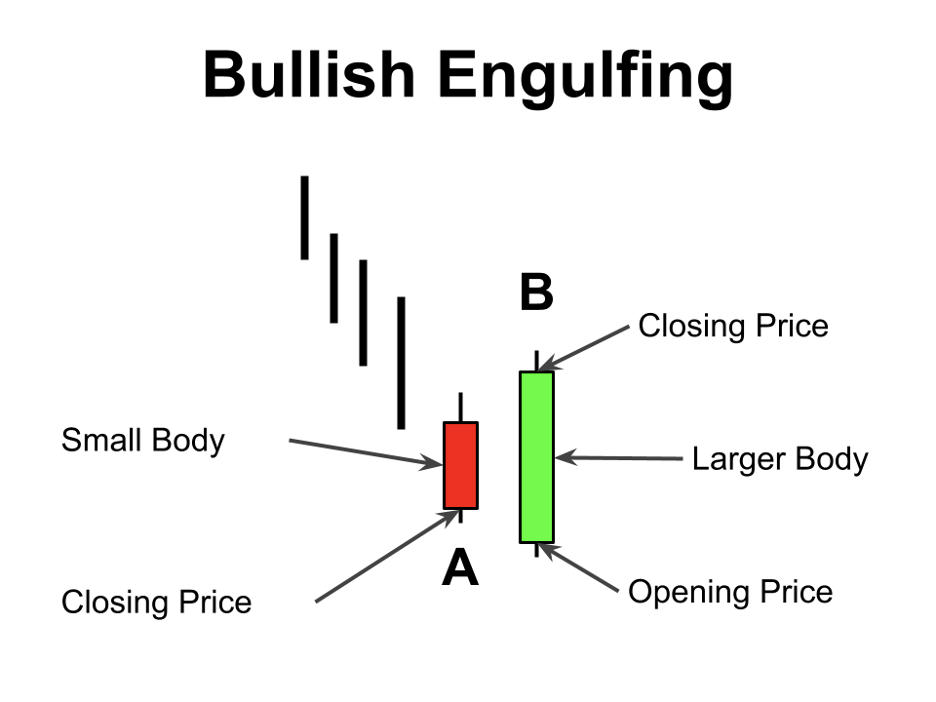
Bullish engulfing candlestick pattern is form by two-candle.
The first candle is bearish (usually red or black). The second candle is bullish (green or white), and it’s body completely “engulf” the body of the previous bearish candle.
Signaling a strong shift in the market sentiment from bearish to bullish.
Bullish engulfing = Reversal trading
Bullish engulfing can signal for a reversal trade.
Let’s take a look of the example below.
The current trend is bearish trend with following by many red candlesticks, as you can see from the market’s structure. This is a showcase that sellers are taking over the market.
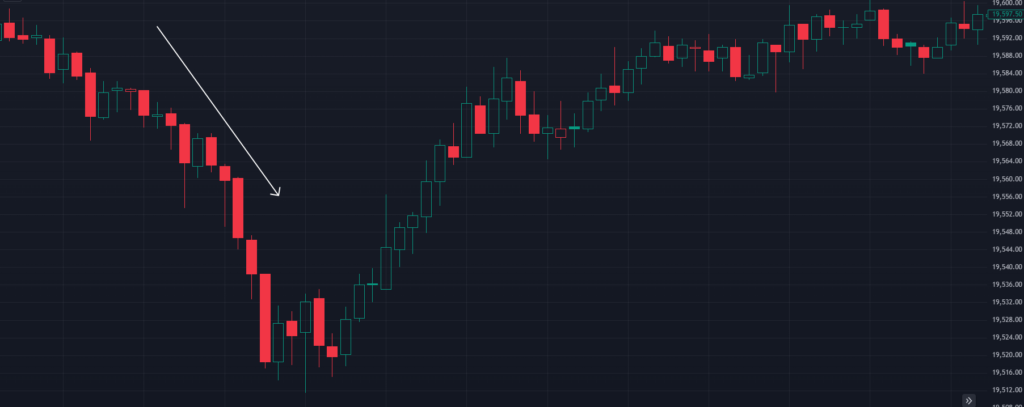
Suddenly, many bullish candle appear. And the Doji candle is followed by a bigger body green candle that is (overlaps) the red candle.
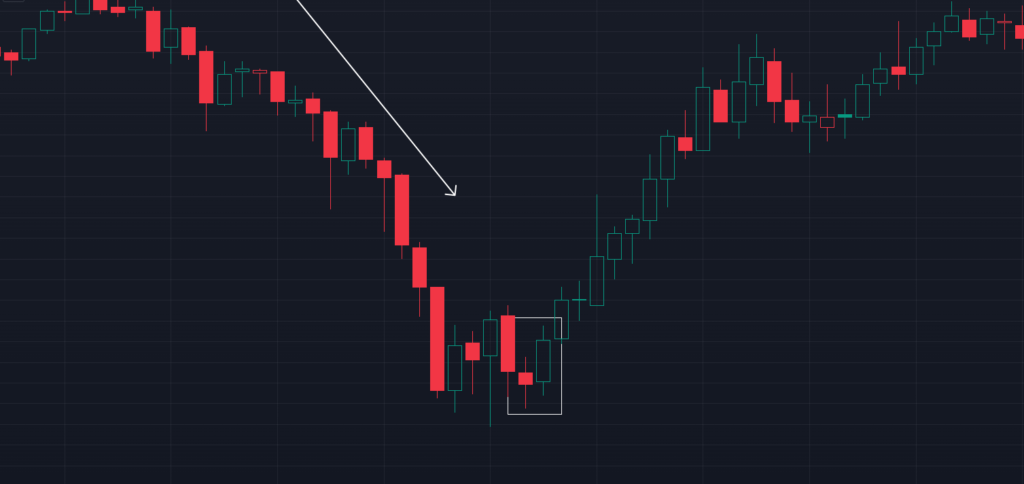
You’re witnessing the formation of a bullish, engulfing candlestick patter. In a powerful display, the green candle “engulfs” the entire red candle, indicating a significant shift in the market sentiment.
Interpretation: A bullish engulfing pattern suggests that the buyers have taken control, potentially signaling the end of a downtrend and the start of an upward move.
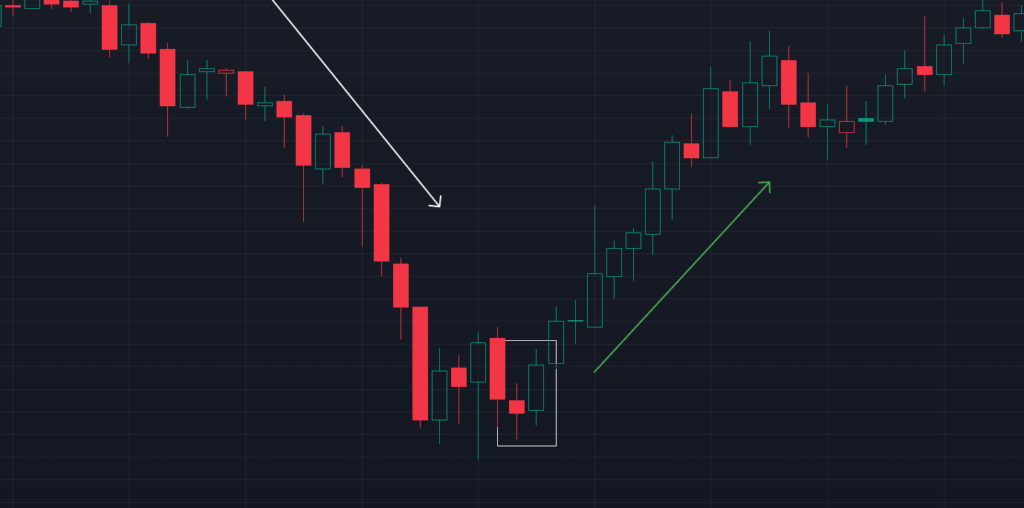
Bullish engulfing pattern signals:
- Bullish momentum
- Buying presence
- Used for long entries
Notes: The bigger the green candle, the higher the quality of the long trade setup likely to happen. As it signals even more buying presence and even more bullish momentum.
Bullish engulfing = Trend continuation
Bullish engulfing can also signal for a bullish trend continuation.
Here’s the example:
You have a moving uptrend.
Price keeps pullbacks after a bullish trend creates selling structure.
But be Careful!
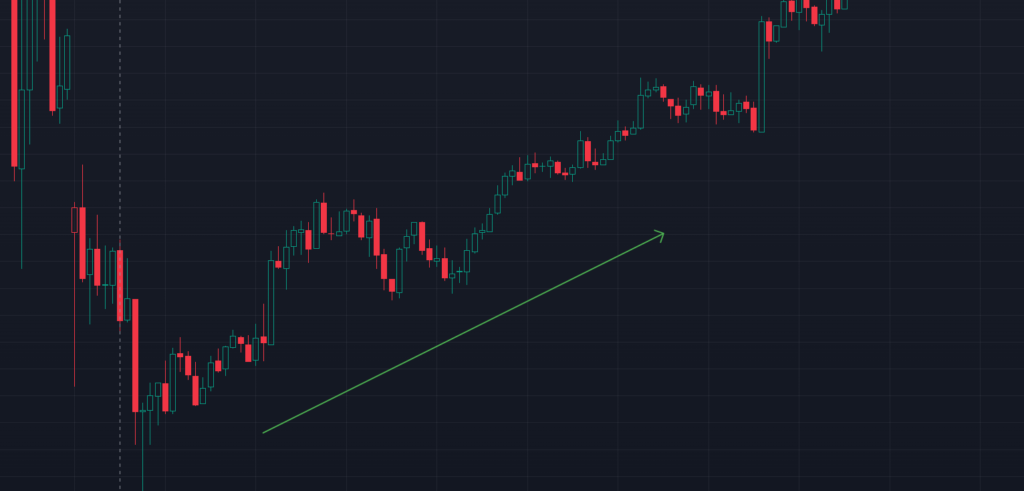
Suddenly, the buyer takes control back with big bullish engulfing candlestick pattern.
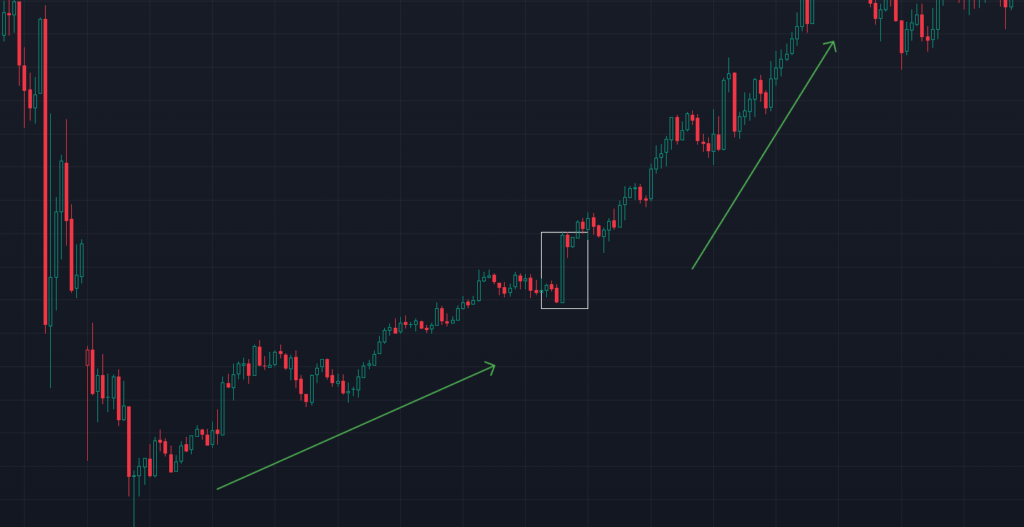
Signaling buyers still want to continue to push strongly the price up. Presented long trade opportunities along the way up.
What is bearish engulfing candlestick pattern?
Bearish engulfing candlestick pattern is also form by two-candle.
The first candle is bullish (green or white). The second candle is bearish (red or black), and it’s body completely “engulf” the body of the previous bearish candle.
Signaling a strong shift in the market sentiment from bullish to bearish.
Bearish engulfing = Reversal trading
Bearish engulfing can signal for a reversal trade.
Let’s take a look of the example below.
The current trend is bullish trend with following by many green candlesticks, as you can see from the market’s structure. This is a showcase that buyers are taking over the market.
Suddenly, a bearish candle appears. The green small Doji candle is followed by a bigger body red candle that is bigger (overlaps) than the red candle.
You’re witnessing the formation of a bearish, engulfing candlestick patter. In a powerful display, the red candle “engulfs” the entire green candle, indicating a significant shift in the market sentiment.
Interpretation: A bearish engulfing pattern suggests that the sellers have taken control, potentially signaling the end of a uptrend and the start of a downtrend move.
Bearish engulfing pattern signals:
- Bearish momentum
- Bearish presence
- Used for short entries
Notes: The bigger the red candle, the higher the quality of the short trade setup likely to happen. As it signals even more selling presence and even more bearish momentum.
Bearish engulfing = Trend continuation
Bearish engulfing can also signal for a bearish trend continuation.
Here’s the example:
You have a moving downtrend.
Price pullbacks, created buying structure.
But be Careful!
Suddenly, the seller takes control back, and as you can see, the price keeps forming an engulfing candlestick pattern.
Signaling sellers still want to continue to push the price down. Presented short trade opportunities along the way down.
What does engulfing candlestick mean?
An engulfing candlestick pattern is a significant technical analysis signal that suggests a potential reversal in the market’s direction.
The term “engulfing” refers to the way the body of the second candle in the pattern completely “engulfs” the body of the first candle.
Reversal signal
The engulfing pattern is typically seen as a sign that the momentum in the market is shifting.
For example, in a bullish engulfing pattern, the strong buying pressure in the second candle may indicate that the downtrend is losing strength and that a potential uptrend could be starting.
Conversely, in a bearish engulfing pattern, the strong selling pressure may suggest that the uptrend is weaking, potentially leading to a downtrend.
Market sentiment
The engulfing pattern reflects a change in market sentiment. If it’s bullish, it shows that buyer have gained the upper hand over sellers, and if it’s bearish, it shows that sellers have overtaken buyers.
Trend reversal
Traders use engulfing patterns to identify potential turning points in the market.
These patterns are often more reliable when they occur after a prolonged trend, near key support or resistance levels, or in conjunction with other technical indicators.
How to trade engulfing candlestick?
So now we have already gone through what engulfs candlesticks and how we can use them as a practical technical analysis to predict potential moves in the market. But how do we trade with it?
You should know that just using candles on their own isn’t enough, as it can lead to a lot of fake out trade signals.
We always need to combine candlestick patterns with key price action techniques.
Here are three strategies we are going to cover using the engulfing candlestick pattern:
Supply and demand strategy entry
Example 1 :
This is a ticker symbol: SPY (SPDR® S&P 500® ETF)
The first reversal point gives you a critical resistance level (supply zone).
As the price returns to the level, you can see an inverted long wick candle, which shows a reaction to the level.
Notes: A reaction does not equal a trade as the price can “stall” at the level, still break through, and continue upwards as you are in a moving solid trend.
You then wait and see if you get trend change price action, which you had through the bearish engulfing candle that is also a candle color change.
All which shows momentum loss from the buyers profit taking and selling presence. You would then look for a short trade setup once you had trend change confirmation.
Example 2 :
This is a ticker symbol: SPY (SPDR® S&P 500® ETF)
These reversal points here are in the same general area( support or resistance zone) but not close enough together.
This means you can not draw a slim level but have draw a wide Zone to encompass the entire area.
Price then enters the wide Zone and form two long wick candles, presenting a long trade opportunity.
To confirm this long trade setup inside of the white Zone is valid. You wait and see if you get trend change price action, which you got through the bullish engulfing momentum candle.
Which is then when you look for long entry points.
Break and retest strategy entry
Example 1 :
This is the dollar CAD currency pair.
These reversal points here create a wide Zone.
Once the price enters the Zone, you have long wick candle form showing momentum loss.
You then had the bearish engulfing candle form that exited the Zone, and that is when you would look for short entries.
Your exit would be this swing low here.
Example 2:
Example 3:
Trend Continuation strategy entry
Example 1:
This is a ticker symbol: SPY (SPDR® S&P 500® ETF)
This chart shows a solid long trend from the 558.82 demand (support) Zone.
Let’s assume you still need to catch up with this supply and demand entry setup. And you want to continue participating in the bullish trend.
Here is what you can do:
As seen in this example, you wait when the price has a pullback structure, forming red candles.
Now you wait for the price to appear bullish engulfing candlestick pattern. And that is when you would look for a long entry.
Your exit would be this supply zone.